Forecasting
Optimization
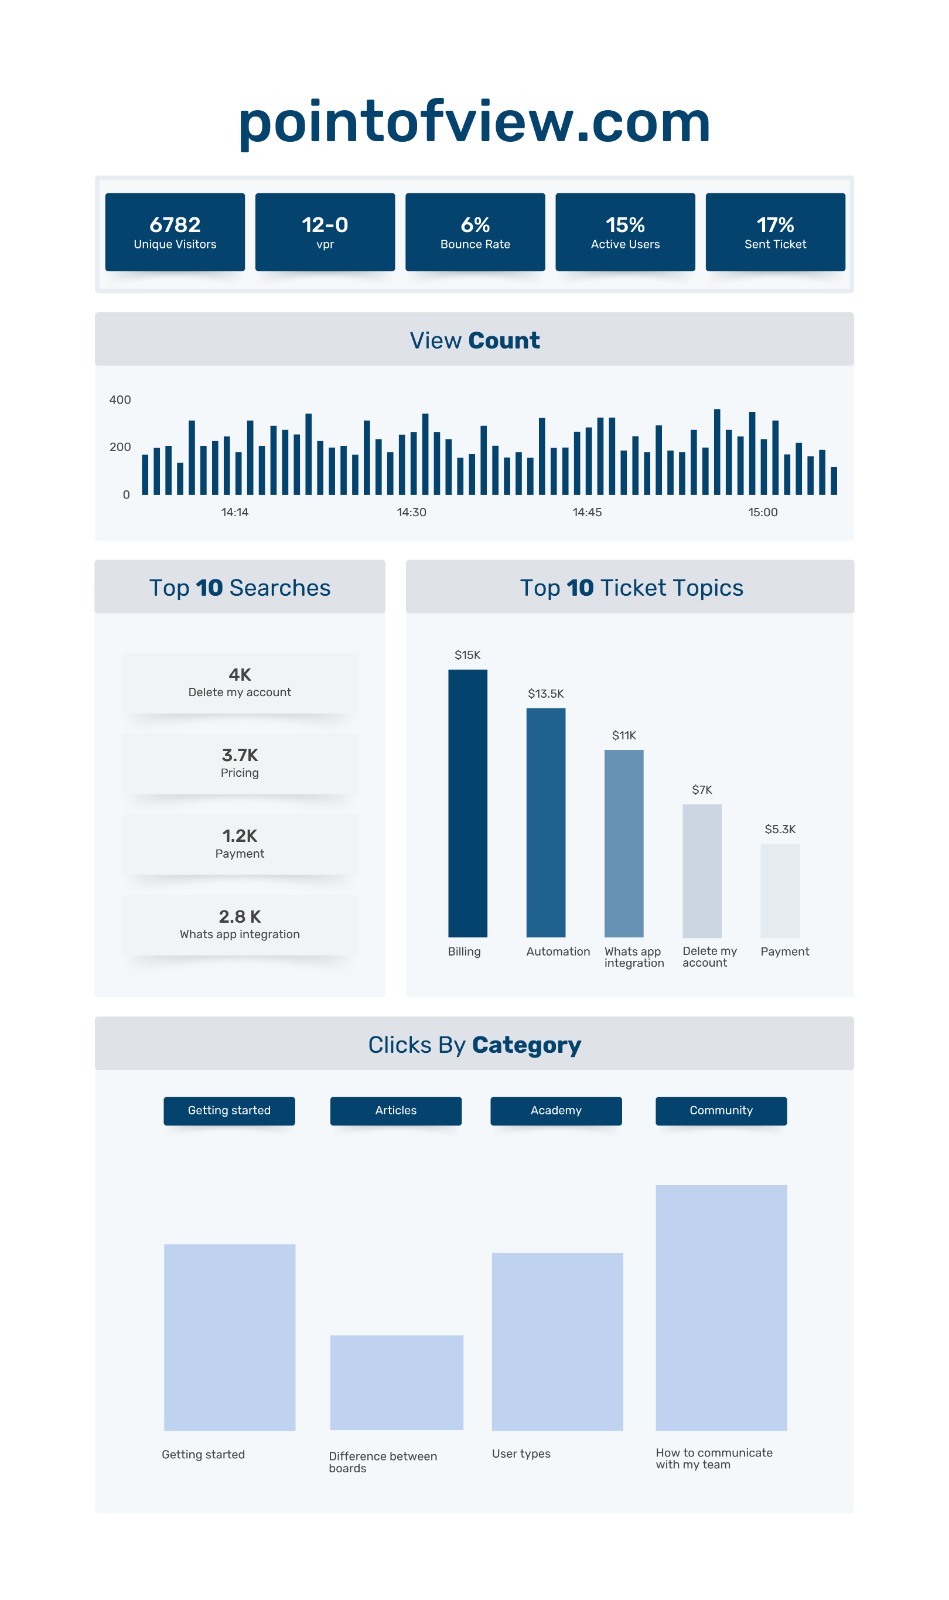
Customer Portal
Analytics
Success
Through strategic data analysis and process optimization,
We transformed financial planning from a challenge into a competitive advantage.
A growing company faced gaps between projected and actual revenues, impacting financial planning and strategy.
Our Data Solution:Unified data from sources like NetSuite & Salesforce Automated KPI tracking & real-time monitoring Identified bottlenecks in processes.
Streamlined reporting
Synchronized financial deadlines
Error prevention & dynamic revenue dashboards
Improved accuracy, efficiency, and decision-making through data-driven transformation
forecast
accuracy
By implementing data-driven strategies, we transformed a basic portal into an efficient, user-centric platform that aligns with modern business needs.
Limited visibility into user behavior and performance metrics, brand inconsistency in design, complex user journey with unclear patterns.
User behavior mapping.
Cross-reference customer demographics.
Strategic A/B testing framework.
Streamlined content discovery system.
Enhanced user journey tracking.
Unified data collection formats.
Automated performance dashboard.
Standardized reporting protocols.
process
friction
lead
time
forecast
accuracy
process
friction
lead
time


Integration of data from different sources
Assisting in asking the right questions based on business needs
Data analysis and insight generation
Building decision-support dashboards using BI tools

Data preparation and cleaning services for optimal quality
Data validation and standardization processes
Real-time monitoring: quality tracking, alerts, and performance analytics


Analyzing user behavior on websites or apps
Customer journey mapping and drop-off detection
Defining measurable goals Product growth recommendations
Recommendations for product improvement with a future growth perspective
Financial data analysis
Financial data analysis
Budget control
Identifying gaps between planning and execution, analyzing, and drawing conclusions
Creating reports and dashboards